Connect the information
Map available sources and interfaces to understand what can be brought into a consistent operational view.


Connect operational information, meaningful measures and intuitive reporting. Give your team a clearer view of what is happening and what deserves attention.
Useful reporting starts with the decisions your team needs to make, and the data you can trust.
Information often sits across cameras, vehicles, energy equipment and separate business systems. SmartGen helps define how compatible sources can come together in dashboards and reports that reflect your actual operation.
We focus on clear measures, data quality and usable workflows, so the result gives operators and managers relevant context instead of simply displaying more numbers.
Map available sources and interfaces to understand what can be brought into a consistent operational view.
Define metrics, time periods and comparisons that answer the questions your teams actually ask.
Shape dashboards and reports around operational handovers, management reviews and planning conversations.
Start with a defined question, then connect the data, analysis and presentation needed to answer it.
Review the systems, interfaces and datasets already available in your operation. Establish what can be collected, how it is structured and who owns it before defining the integration scope.
Teams working across separate platforms and infrastructure assets

Plan clear views for operators, managers and project teams. Agree the questions each dashboard should answer, how measures are calculated and which details need to be available for closer review.
Control rooms, fleet teams and infrastructure managers
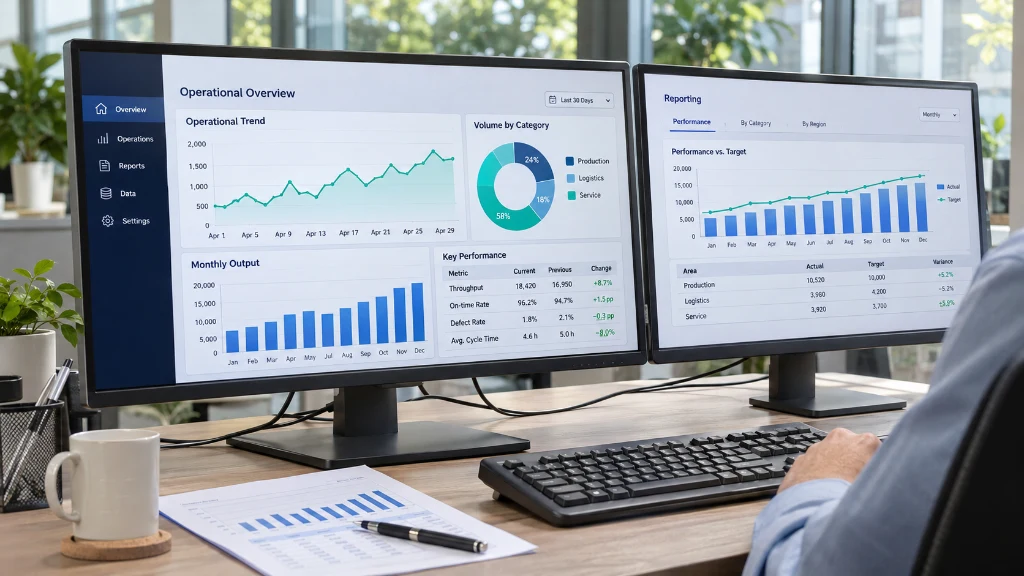
Use available operational history to compare periods, understand recurring patterns and review exceptions. Context matters: data gaps, changing conditions and measurement limits should remain visible alongside the analysis.
Transport, fleet, energy and infrastructure performance reviews

Turn the right observations into a reporting structure that supports handovers, management discussions and planning. Define the audience, reporting period and required outputs before agreeing delivery or distribution arrangements.
Managers and stakeholders who need consistent operational reporting
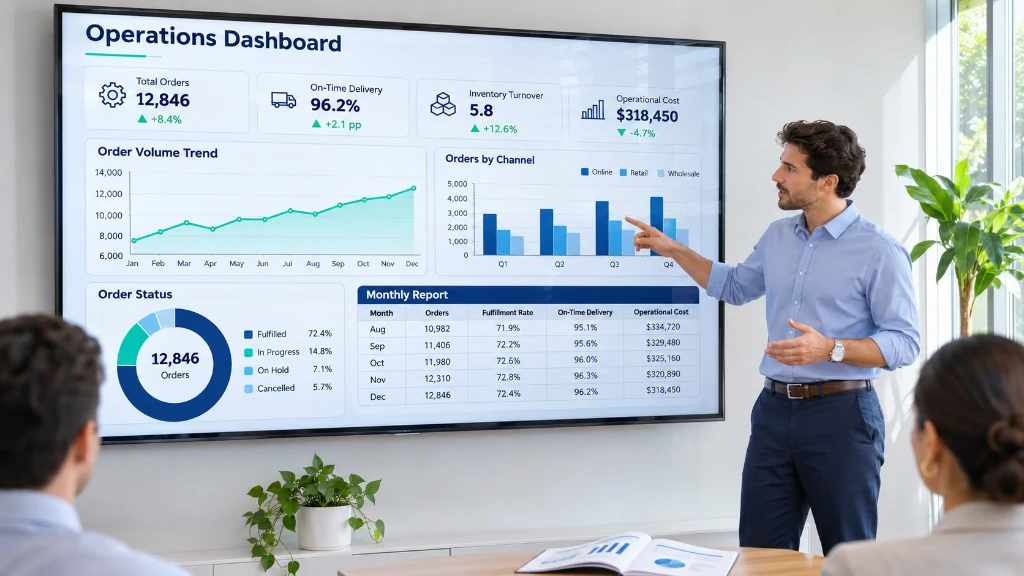
Clear definitions and a considered data flow make dashboards and reports easier to understand and maintain.
Identify accessible sources
Review structure and quality
Compare meaningful measures
Present useful findings
Illustrative workflow. Available analysis, refresh intervals and reporting outputs depend on source data and the agreed scope.
A useful reporting project aligns business questions, source data and the people who will use the output.
Identify users, operational questions, reporting audiences and the measures that would make their work clearer.
Questions & reporting prioritiesAssess available datasets, interfaces, access arrangements, update frequency and known data quality limits.
Source & integration assessmentAgree definitions, dashboard structure and reporting outputs, then review them against representative information.
Dashboard & report scopeDocument agreed measures, ownership and operating responsibilities so teams understand the information they use.
Definitions & handover planBring sample reports, a list of data sources, available interface documentation and the questions your current reporting cannot answer.
Start a conversationA useful dashboard reflects the equipment, workflows and decisions in the environment it supports.
Tell us what your team needs to understand and where your information comes from.
Discuss your reporting priorities
Bring available traffic observations, events and operational information into views for network reviews and planning.

Review available journey, vehicle and safety data against clearly defined fleet reporting needs.

Understand generation, consumption and storage information from compatible equipment and monitoring systems.

Connect information across sites and assets to support consistent status reviews and stakeholder reporting.
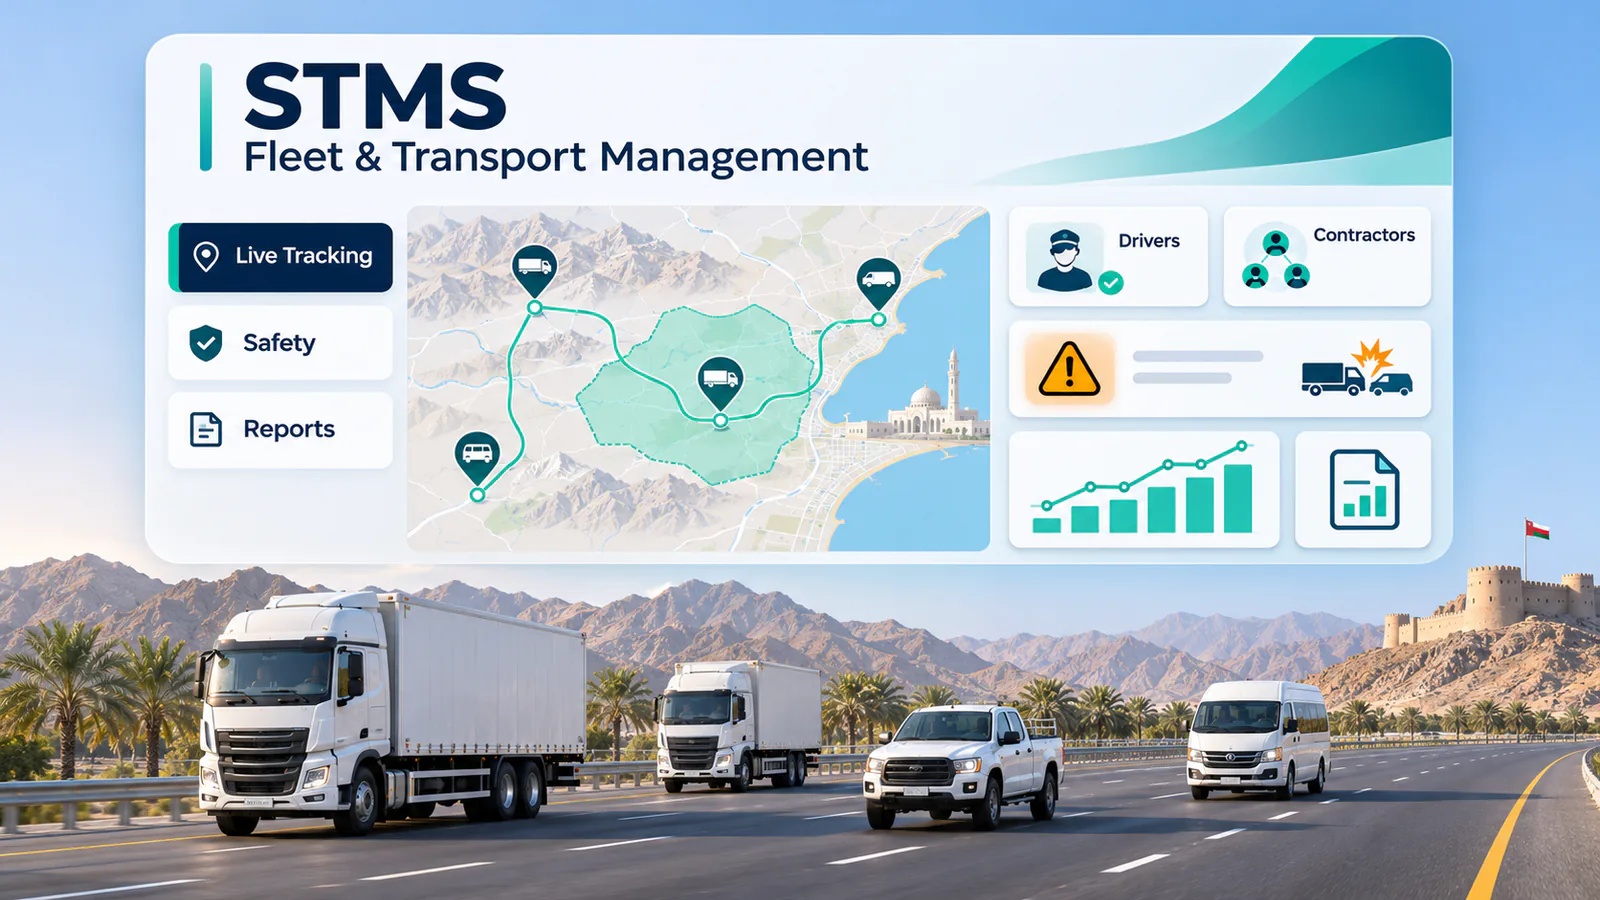
A partnership to build a Smart Transport Management System for Oman’s energy sector.
View projectExplore the software, dashboards and integration work that can connect infrastructure information with operational needs.
Explore solutionSee how traffic observations and transport information fit into a broader mobility and safety programme.
Explore serviceSet useful expectations around data, dashboards and the information available to your team.
Ask our teamConnectivity depends on the interfaces, export options and access arrangements provided by each source. Share your systems, sample data and available technical documentation so we can assess compatibility and define the integration work required.
Refresh frequency depends on the source, connectivity and agreed system design. Some information may be available frequently, while other sources provide periodic updates. The proposal should clearly state expected refresh intervals and any limitations.
We start by reviewing your metric definitions, calculation rules, reporting periods and audience. Existing KPIs can be assessed against the data available, with any gaps or changes clarified before the dashboard and report scope is agreed.
Not necessarily. The first step is to assess the systems already in place and whether the required information is accessible. Some requirements may be addressed through integration or reporting work; others may need additional tools or changes to the source systems.
Any predictive requirement needs a separate assessment of data history, quality and the problem being modelled. Standard dashboards and trend reporting do not automatically provide reliable forecasts. We clarify what is feasible before including predictive work in scope.
Data ownership, permitted use, hosting arrangements and user access requirements should be agreed before integration. Share your organisation’s requirements and source-system restrictions so responsibilities and technical controls can be reviewed as part of the project.
Smart data analysis & reportingTell us what your team needs to understand, where the data sits and how you currently report. We can help define a useful next step.